Statistical Process Control
Clear insight into processes and fewer variations and inconsistencies
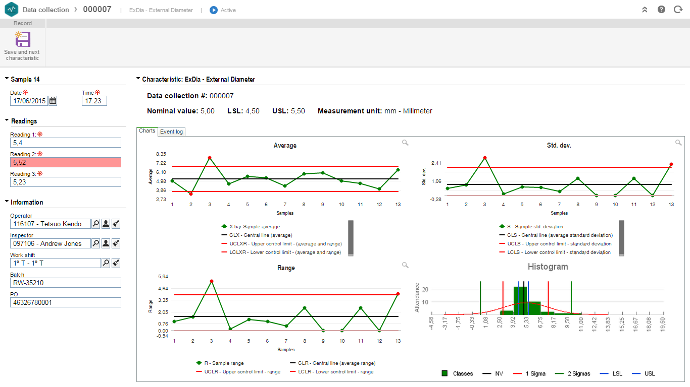
SoftExpert Statistical Process Control, is a solution designed to collect and analyze data easily allowing you to monitor performance and achieve sustainable improvements in quality and profitability. SoftExpert SPC uses control charts as a primary tool for statistical process control. Control charts are used to determine whether a manufacturing or business process is in a state of statistical control or not. They are also used with product measurements to analyze process capability and for continuous process improvement efforts.
The solution is specifically designed to be scalable, which means no architectural changes are necessary as you add new users, processes, data categories, specific reports, and integration with other SoftExpert modules or new data sources.
Most importantly, SoftExpert SPC enables organizations to improve overall quality, and reduce costs and risks associated with a growing number of
regulatory compliance
and
corporate governance
processes such as those related to the ISO 9000 Quality Guidelines,
IATF 16949
, FDA 21CFR Part 11 Electronic Record Keeping, and others.
Screenshots
Features
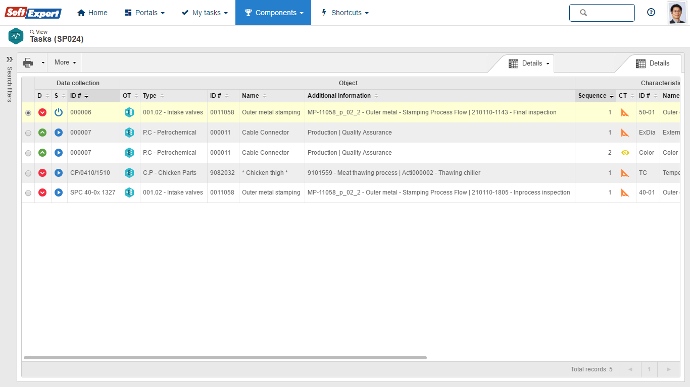
- Monitors process quality.
- Instantly signals problems or anomalies detected in processes during data collection.
- Sends violation data to an event log or alerts operators to enter information, such as possible causes, annotations and corrective actions.
- Provides information to justify changes in processes.
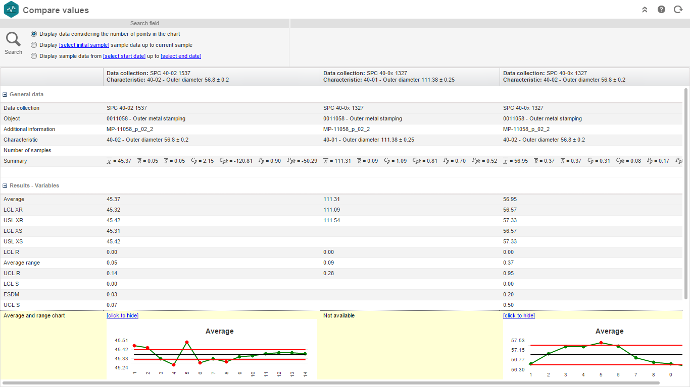
- Supports process capability (Cp, Cpk) and process performance (Pp, Ppk) analyses compared to product tolerance.
- Multiple SPC graphics can be simultaneously displayed and updated in real time, including charts (XR, XS, p, np, c, u), histograms, Box Plots, average, amplitude and standard deviations, traffic light charts and evaluation bands, among others.
- It allows for data collection, in a simple manner, using screens similar to a spread sheet.
- Automatic data reading via integration with measuring instruments and coordinate measuring machines (CMMs).
- Provides an environment for scenario simulation.
- Allows for the use of real-time data to monitor, predict and make adjustments online to ensure production quality and consistency.
- It allows for the stratification of data, using indices, defects, causes and characteristics in tabular or graphical analyses.
- Maintains a history of all critical system information for auditing purposes and regulatory compliance.